
[This is the third entry of 18 in a game design journal series introducing Spheres & Farms™, a game about real estate brokerage branding in the Puget Sound region. Previous | Next]
The qualities of homes vary unpredictably, not only between states or regions, but within individual communities and neighborhoods. Styles and ages of homes likewise offer scant indication of the quality of a home. Homes of any age can conceal dereliction or obsolescence based on deferred maintenance by the owner, changes to the neighborhood, or the condition of local infrastructure.
Agents avoid investing too much time diagnosing these issues. They skip past them by looking at the median or average price in that community or neighborhood. These measures of central tendency are harnessed as short-form visualizations of real estate values from one location to another. They screen out places that are not aligned with their target market, focusing their efforts on communities that reflect the brand they wish to build. Those agents conducting geographic farming will be familiar enough with their targeted communities that they can quickly bracket the price of any home there whose owner is contemplating a sale. They aim for buyers to assume that the quality will be reflected in the price. (There is more to be said about geographic farming in subsequent journal entries.)
Of course, some of this targeting is happenstance. Agents are likely to target the communities where they live. That however is a choice: both of agents who choose to serve the residential markets most familiar to them, and to the brokerage brands that contract them to serve those markets. These choices will shape the brand’s image to the degree of the brand’s visibility in the agent’s targeted community, and in the quality of homes that the agent lists for sale there.
Measures of central tendency and minimum price thresholds
How useful are the median and average prices as surrogates for values within and across communities?
Availability bias has much to do with the real estate industry’s reliance on measures of central tendency. Median and average home prices are regularly published by regional multiple listing services, real estate portals like Zillow, and most agent applications. They are readily understood by most buyers and sellers (although often confused by many who have not taken basic statistics). However, they are often used as benchmarks in communities where the population of transactions over a quarter or a year is too small; or conversely, across wide areas where the diversity of the housing stock renders them meaningless.
Another way that agents use statistics for targeting communities is to set a threshold price, and count the number of sales in that area that meet or exceed that threshold. For example, the Northwest Multiple Listing Service (NWMLS) has regularly published the number of homes sold in western Washington State at prices at or above one million dollars. Brokerages have used these figures to target areas within the region for marketing and promotion, while agents themselves used these figures to solicit listings. Before prices rose sharply in the mid-2010s, most presented sales over these thresholds as indicating where luxury sales were being transacted in the region.
Arguably, both the use of median or average selling prices, and of minimum price thresholds, are potentially erroneous and, in any case, self-limiting methods of determining where the most brand-aligned homes are being sold. A home sold for three million dollars in a highly affluent neighborhood like Medina, Washington, might be qualitatively inferior to a home sold at a similar price on Hood Canal, or at Eastsound on Orcas Island; i.e., a far grander home might be purchased in either of the latter two areas on the same budget. The affluent are frequent buyers of second homes and investment properties, and their purchases of such properties are not confined to communities near the urban core.
Percentile price bounds
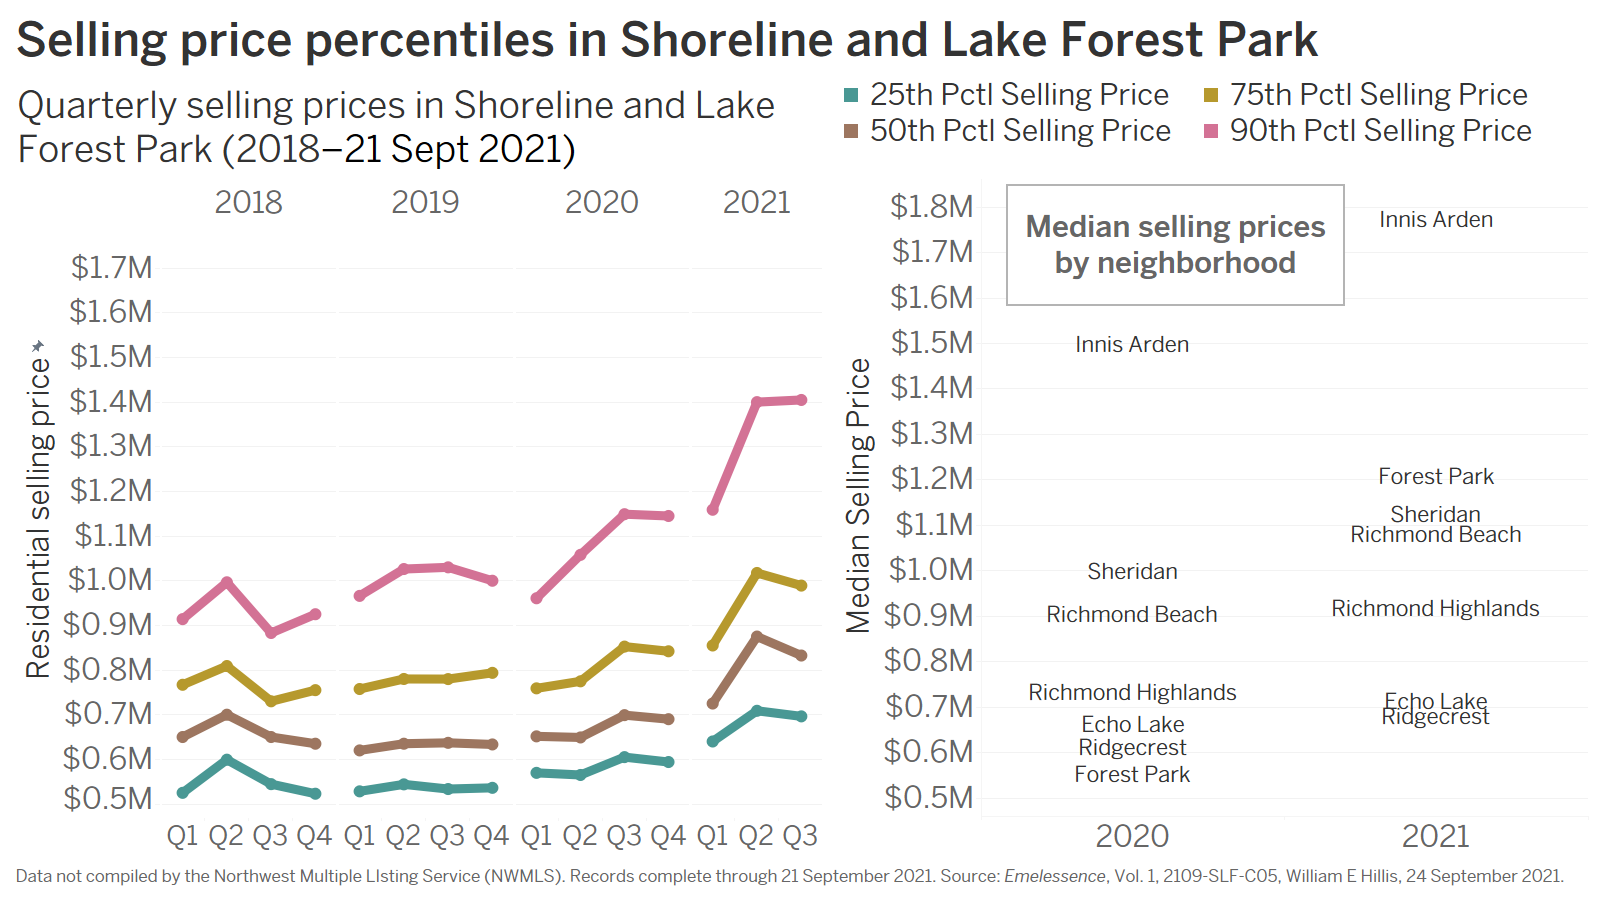
There are alternatives to counts of sales above a threshold and measures of central tendency for more precisely identifying target markets by price. These are very seldom used by agents or their brokerages, mainly because these small companies do not employ the talent to regularly publish these measures, and agent applications do not usually offer them (at least not to date). One of these is to break out selling prices by percentile price bounds. For example, identifying homes priced below the 25th percentile bound, between the 25th and the 50th percentiles, between the 50th and the 75th percentiles, and above the 75thpercentile price. For more densely populated areas,1 the band above the 75th percentile price can be broken into two: one above the 90th percentile, and one below.
Using percentile price bounds instead of the measures previously described allows agents and clients to see into the depth of prices at which homes are listed and sold in a community. It also allows something more of an apples-to-apples comparison of homes at or between the same percentile bounds locally, but across geographically distinct areas: e.g., comparing homes in the top ten percent by price in their respective communities with those in the same price band elsewhere in terms of value for money, judged by qualities and amenities of those homes. Further analysis can show whether prices within a community are rising or declining at similar rates along different price bounds. (Often, they are not.) Among larger communities or towns, still further analysis can place sales of homes in different neighborhoods within distinct price bands in those areas. This allows agents, sellers, and buyers to see and compare prices among those neighborhoods, even when the listing volumes are insufficient to produce reliable median or average prices.
Buyers and sellers will make the connection between home quality and brand regardless of this information. Being able to visualize it, either in their own business planning or face-to-face with clients, allows the agent and the brokerage brand to consciously target communities and neighborhoods to shape brand image and visibility to their advantage. For the agent, especially an agent conducting geographic farming within a single community or an isolated area, this is fairly straightforward and may proceed intuitively. For an agent engaged in sphere marketing, more comprehensive thinking may be needed. Especially for a brand-affiliate brokerage with more ambitious plans than those of an independent “street-corner” brokerage, a more comprehensive approach to understanding the regional constellation of communities would be beneficial.
1 None of these measures are appropriate for sparsely populated areas, as there will not be enough cases to be meaningful. Percentile price bounds are perhaps most reliable as quarterly rather than monthly measures.
Schedule of entries
- Spheres & Farms™ design and strategy journal: introduction
- The agent and brokerage as real estate brands
- Visualization, testing, and learning
- Spheres & Farms™ game summary
- Game procedures and routines in the context of agency law and practice
- Game components; agent counters and cards
- Farming methods; market selection
- More about marketing spheres; the economic cycle track (ECT)
- Economic cycle effects on marketing spheres
- Location cards: the Spheres & Farms™ “game map”
- Location card contents, office locations and maintenance
- The prospecting/event card deck
- Prospecting for listings and incurring events
- P&CR points: promoting and selling listings
- Construction projects and pre-sales
- Visibility points: accumulation and scoring
- Sequence of play