
[This is the ninth entry of 18 in a game design journal series introducing Spheres & Farms™, a game about real estate brokerage branding in the Puget Sound region. Previous | Next]
Except for the “FB1G” network, matching the “Foreign Buyers and First-Generation Residents” sphere, for simplicity’s sake, it is assumed that all networks are at least theoretically open to any agents. (Cultural ties to an FB1G network offer indisputable advantages to building a marketing sphere within that network.) The benefit of building a sphere is the opportunity to make sales among network members. Listing opportunities are competitive, and cannibalization adversely affects the brand as well as the individual agents. If the network has already been targeted by other agents, newer agents will tend to seek opportunities in networks where the competition is thinner, or else revert to geographic farming. The inability to quickly shift from farming in one market to another will compel players to think carefully where agents can maximize listings and sales, and therefore visibility for the brand.
The number of marketing sphere boxes is necessarily limited, both for simplification of play and due to the corresponding limitations of the parallel economic track. The boxes are aligned to demographic categories, most of which correspond to the kinds of work in which a member is engaged: Main Street (principally business owners), professionals (including doctors, lawyers, and consultants), cloud retail/IT/media, aerospace, and homebuilders. Others include the FB1G networks and contracted buyers, a box reserved exclusively for agents operating as buyers’ agents. Agents in the homebuilders’ sphere box enjoy countercyclical demand effects described below under “Economic cycle effects on marketing spheres.”
[Addendum: After publishing, I realized that I needed to further explain the comparative monolithicity of the marketing spheres, and how that is a necessary concession to demonstrate how agents are associated with these populations.
I anticipate the response, “None of our agents are members of only one group. Their marketing spheres consist of people from all sorts of associations.” There is no doubt about that. One agent is a member of the Chinese diaspora, and a former accounting professional with many friends at local audit firms, having as well former audit clients in the IT industry. Another is a retired government executive with ties to local builders and architectural firms. These sorts of relationships are common, but in a game of this scale, what happens if we allow agents in game terms to attach to more than one relevant group?
The result will be an unmanageable tangle of relationships that does not convey any information, but bogs down the game and prevents formation or execution of any strategy. We know that the benefit from the brand’s perspective is to have multiple spheres covered by a team of agents working individually through their own associations. Assembly of that team can be more meaningfully illustrated in the game by associating agents one-to-one with exemplary marketing spheres. From agent to agent, these discrete relationships may not reflect real life. Taken together however, their results will better resemble what actually can be expected from a targeted approach of these market segments.]
To ensure interoperability of geographic farms with the economic cycle track, there is a geographic farming box included on the sphere marketing panel. This is for convenience only and not meant to imply that geographic farming is a kind of sphere marketing, and no farming markers are to be placed in this box. Demand tokens here are available to geographic farming agents on any location card. Like the demand tokens in the marketing sphere boxes, they are drawn down until they are exhausted, unless replenished by an event card play or turn in the economic cycle.
The economic cycle track
Adjacent the marketing spheres on the combined records mat, the economic cycle track (ECT) appears as a stylized progression of boxes on the right. The ECT models buyer behavior directly, and listing behavior indirectly through the listing card deck.
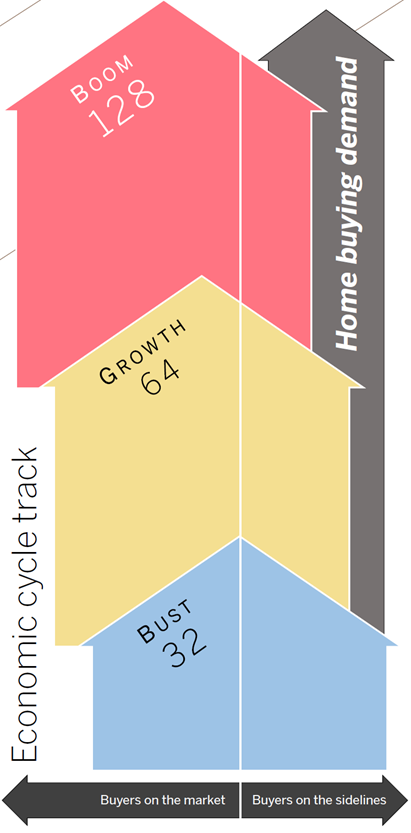
The ECT has three sections, read from bottom to top: Bust, Growth, and Boom. Each phase is a container illustrated with an arrow pointing to the next phase. The arrows are positioned irregularly with a white line dividing them. To the right of the white line is the “Buyers off the market” side of the phase container. To the left of the line is the “Buyers on the market” side of the phase container, which extends to the marketing spheres to the left of the track.
So the ECT is modeled as a path; but another way of understanding the track is as a matrix of two columns and three rows: one row for each phase of the Economic Cycle, and two columns for marking buyers’ engagement under those economic conditions.
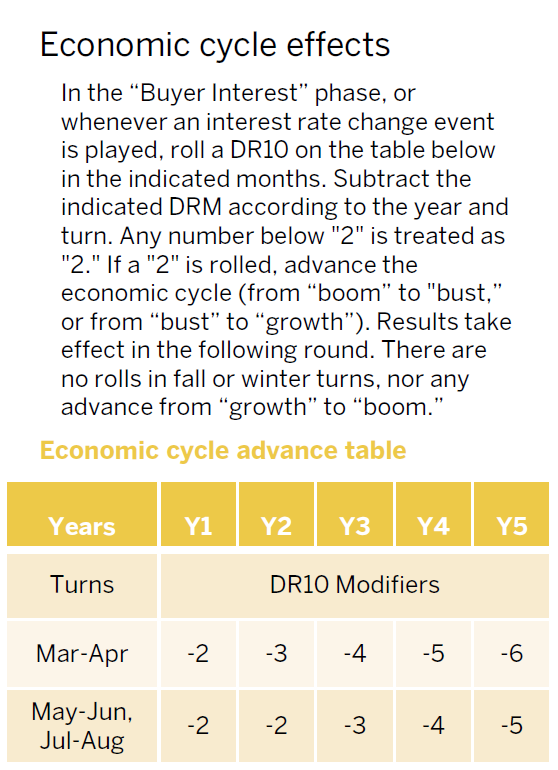
The economic track performs several key functions: to mark and summarize the current economic conditions influencing home selling markets; to calibrate the number of listing and selling opportunities available per turn, as well as fulfilled or sidelined demand; and to provide a vehicle for enacting the effects of certain event card plays. Current conditions are indicated by an economic cycle marker that is moved from one phase to the next based on the outcome of a die roll on the Economic Cycle Advance Table.14
Spheres & Farms™ uses many procedures and features such as tables and DRMs common to conventional wargames, with one notable exception: while turn increments are regulated (bimonthly from March through October, with four months for each winter), turns are not fixed to any specific historical timeframe between 2010 and 2019. This is because some elements of the game such as new construction projects are adversely impacted by economic cycles and would be subject to manipulation if players knew in advance when an economic cycle shift would occur. The inability to anticipate such events is a fog-of-war element that needs to be simulated in order for the game to reflect actual business conditions under which decisions are made.
The economic cycle drives the number of rounds of play per turn. Because the turns are of fixed length (two months each except for the four-month winter turns), the ECT iterates the amount of selling that is taking placed within the turns. When a “boom” is indicated, each turn has three selling phases followed by a single cost recovery phase. When a “bust” is indicated, selling phases alternate one-to-one with cost recovery phases. Under conditions of economic “growth,” two selling phases precede the cost recovery phase each turn.
Listing demand
The ECT also adjusts the number of listing and selling opportunities available within a single turn, and by extension, available for geographic farming and to each of the marketing sphere boxes. Moreover, the demand tokens available among the different bounded ordinal categories of value (BOCVs, or simply “OC”s), symbolized by the different colors of demand tokens on the track, are also iterated according to the current economic conditions. (See the next journal entry, “Economic cycle effects on marketing spheres” for more about OCs.)
14 The campaign scenario begins with the economy in a boom phase. Once a bust is followed by a growth phase, no further rolls on the Economic Cycle Advance Table need be made: in the next and all subsequent years, the economy remains in a growth phase.
Schedule of entries
- Spheres & Farms™ design and strategy journal: Introduction
- The agent and brokerage as real estate brands
- How price and place matter
- Visualization, testing, and learning
- Spheres & Farms™ game summary
- Game procedures and routines in the context of agency law and practice
- Game components; agent counters and cards
- Farming methods; market selection
- Economic cycle effects on marketing spheres
- Location cards: the Spheres & Farms™ “game map”
- Location card contents, office locations and maintenance
- The prospecting/event card deck
- Prospecting for listings and incurring events
- P&CR points: promoting and selling listings
- Construction projects and pre-sales
- Visibility points: accumulation and scoring
- Sequence of play