
[This is the eleventh entry of 18 in a game design journal series introducing Spheres & Farms™, a game about real estate brokerage branding in the Puget Sound region. Previous | Next]
(This discussion of location cards refers specifically to locations, areas, communities, and neighborhoods. In this context, “location” is meant to identify generally where a listing is to be found. An “area” is part of a broader region that may contain several cities towns, or other communities. “Community” refers to a recognized place within an area that is represented by a location card. A “neighborhood” is a community within a city.)
There are 178 location cards in Spheres & Farms™. Why so many, and why cards and not a map?
First, the number of locations is based on a great majority of communities in which my host brokerage at that time had obtained five or more listings of homes for sale between 2017 and 2019. Collectively, these markets were considered to reasonably reflect the variety of directions in which my brokerage could expect to expand their business. They included areas where some of the brand’s leading brokers were conducting nearly all their business at that time. Excluding them would effectively hide those brokers’ operations from the game. (Actual named brokers were then still a criterion to be met by the game design.)
Three desires suggested this great number of location cards: first, to maximize flexibility in geographic targeting; second, to model the choices of markets available to agents and managing brokers in the game; and third, to model the effects of chaos when trying to pursue these strategies under conditions resembling those in real life. Regardless of where they may be prospecting, agents often receive client requests to list from places where they do not normally work. Few turn these offers down or refer them to fellow agents nearby.16
Including all these cards has not been considered to overconsume space. Location cards do not enter play unless they have farms, offices or listings; and they can be removed from the table when those operations have closed or expired. A game with all five players and the maximum number of agents is unlikely to require deployment of more than a third of the location cards. A key challenge of the game is to identify and successfully target a combination of those locations that delivers maximum visibility to the brand.
As for the map, the early design called for one; but it quickly became clear how unmanageable that would be.
Many games rely on printed maps. If you are old enough to remember travel before GPS, you will have a practical recollection of the non-scalability of such maps. When driving to an unfamiliar city or town, you might use an atlas to navigate the highways. Once you arrived, you might pick up a local map at the gas station to find your way to your destination. The local map necessarily offered finer detail than the atlas could provide. Until GPS, there was no way to scale the details between the intercity map and the street map.
The evolving game system for Spheres & Farms™ requires substantial local information about each location, as well as enough scope to reflect the wide-ranging operations of real estate agents winning listings regionally. This raised a problem of unusual complexity for a boardgame.
Spheres & Farms™ uses many devices and components that will be familiar to wargamers. Like many such games, early drafts of Spheres & Farms™ incorporated a map of Puget Sound regional markets, extending from Pierce County north to the Canadian border, and from Port Angeles in the west, to Kittitas County in the east. This conventional approach quickly turned unworkable due to the number of locations, combined with the amount of onboard recordkeeping needed at each of these locations. A reduced-size, printed version of the map has been kept among the components as a guide to locations, including the selection of an office location in the initial set-up; and for computing the maintenance cost of operations based on their distance from the office. (See “Office locations and maintenance costs” in the next journal entry, “Location card contents, office locations and maintenance.”)
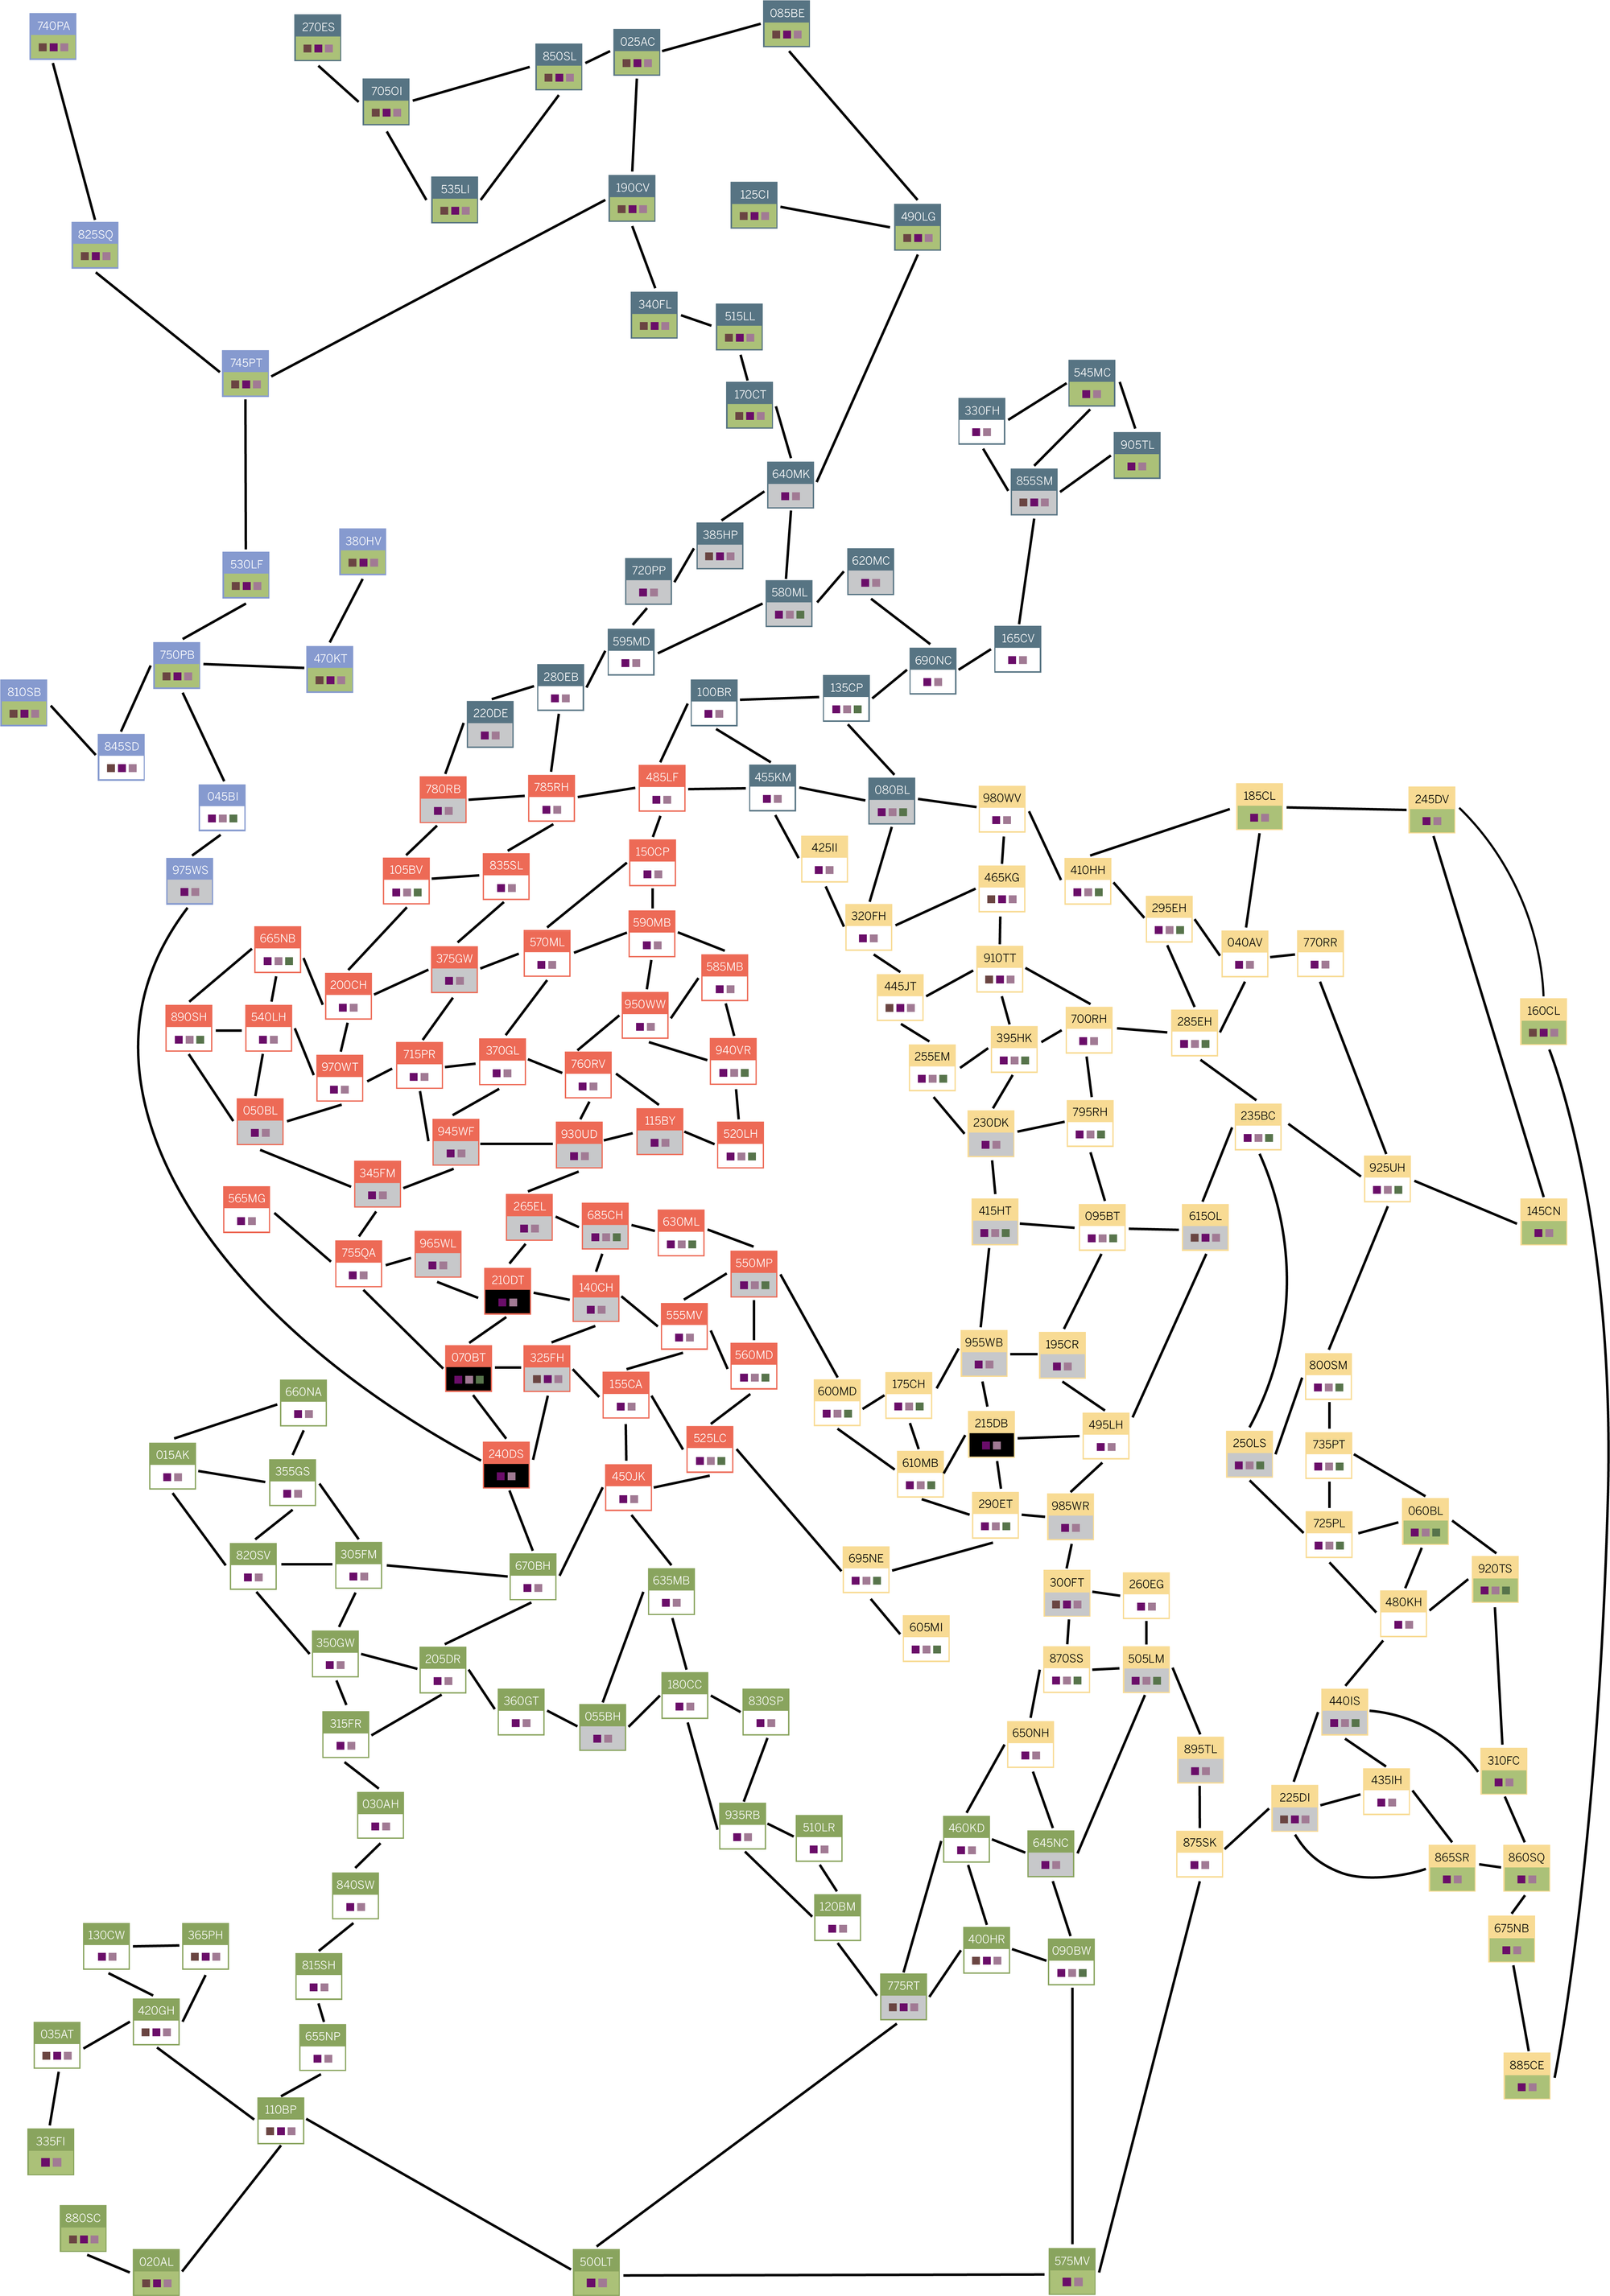
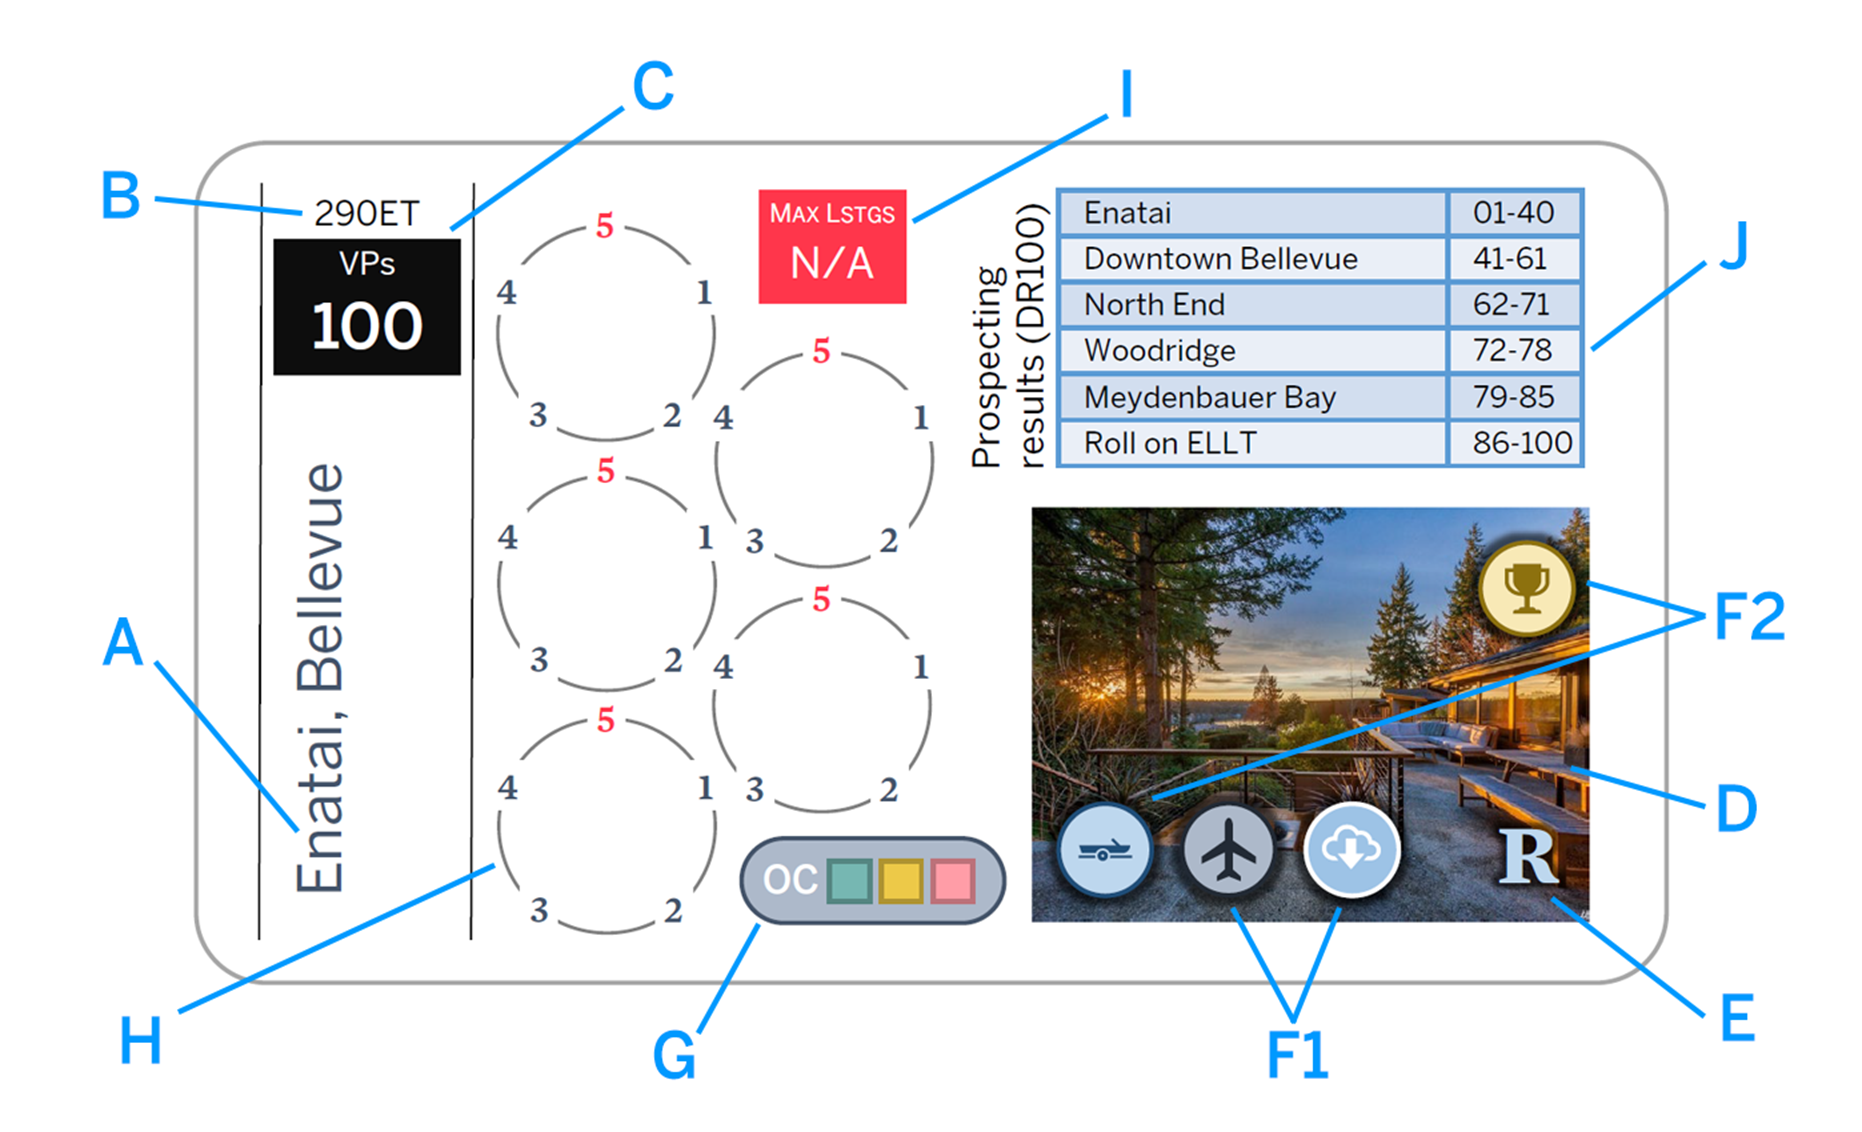
Comparisons with card-based (notably, not card-driven) games led to the current solution: an expandable (and contractable) card-based “map” with all information needed for a single location to be tracked on individual cards. In Spheres & Farms™, each card summarizes all fixed information and current status details needed for a single market:
- along the left-hand edge, the name of the location;
- in the top left-hand corner, an alphanumeric location ID (for potentially extending the game design model to other regions);
- just below the location ID, the number of visibility points available for that location;
- to the lower right, a photograph from an actual listing at that location during the subject time period;
- over the photograph in the lower right-hand corner, the most common density type of real estate to be found at that location, indicated by one of the letters H, U, R, and E (more about these designations in the next journal entry);
- elsewhere over the photograph, the employment (F1) and leisure-related (F2) features to be found at that location, which are relevant to promotions and certain types of events;
- at the bottom center of the card, OCs of potential listings printed serially as brown, teal, gold, and pink squares enclosed in a gray capsule;
- above the capsule and to the left, a group of five clock-like “listing dials” marked with numbers for tracking listings to expiration, and if sold, their subsequent visibility at that location;
- above the dials near the top center of the card, a red or green box indicated alternatively maximum or extra listings available at that location; and
- in the upper right-hand corner, a DR100 table for generating listings from geographic farming in that location.
The cards were ultimately increased to tarot size to accommodate all this information. Cards are added to the table when subject to some activity, such as opening a geographic farm or winning a listing. Once all activity on that card has concluded with all markers removed, the card itself may be returned to the deck of location cards.
How the communities were selected, categorized, and valued
In devising the location card scheme, residential and condominium listings (not sales) were screened twice: first to determine which locations would be assigned cards; and secondly, to score the location cards that were assigned. All these data were obtained directly from the NWMLS. The first screening was for locations where my host brokerage had won listings. The initial focus on premium real estate brands favored a threshold listing price for those listings. This was set at $700,000 among listings sold from early 2017 through late 2019. Communities in which my host brokerage had listed five or more properties from early 2017 through late 2019, sold or unsold, were selected for inclusion in the card deck.
The second screening was to score—specifically, to set visibility point (VP) values—for the communities represented by cards. For these scores, the selling prices of all listings during the subject time period were used. The community with the lowest 2019 median selling price was Port Angeles, at $294,000.
Further explanation of the location card contents will continue with the next journal entry.
16 In these cases, conscientious brokers may propose co-brokering agreements with local agents.
Schedule of entries
- Spheres & Farms™ design and strategy journal: Introduction
- The agent and brokerage as real estate brands
- How price and place matter
- Visualization, testing, and learning
- Spheres & Farms™ game summary
- Game procedures and routines in the context of agency law and practice
- Game components; agent counters and cards
- Farming methods; market selection
- More about marketing spheres; the economic cycle track (ECT)
- Economic cycle effects on marketing spheres