
[This is the seventeenth entry of 18 in a game design journal series introducing Spheres & Farms™, a game about real estate brokerage branding in the Puget Sound region. Previous | Next]
In Spheres & Farms™, visibility points (VPs) comprise the long-term value of brand visibility to be accumulated from listings and sales in different locations. This is how the brand obtains wider recognition throughout the region. There are goals to be met by each player representing an office, and by the players working together to advance the brand. Players who meet or exceed their goals can win the game only if brand objectives also are met.

At-start visibility points
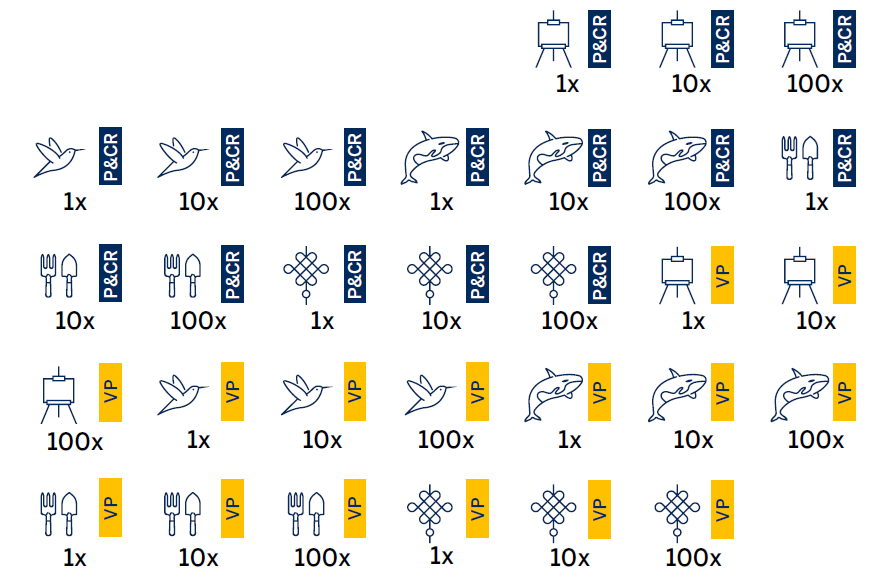
Similarly to P&CR points, VPs are tracked on the Combined Record Track on the Economic Cycle Track and Marketing mat. Players start with zero VPs.
Visibility points are obtained through sales
When by means of prospecting, either through a marketing sphere or by geographic farming, a player lists a home on any location card, that card is marked with a listing flag bearing that player/office’s icon. If it is later sold, the VP value of that card is then transferred to the combined record track using that player’s counters. Subsequent sales by brokers from that player’s office, including, but not limited to that player’s first agent to win a sale, will renew this status until the last sold flag cycles off the card (by passing the fifth tick on the sold flag dial). If this happens, the VP value of that card is then deducted from that office’s current VP total on the combined record track.
Should this occur, and there is already a recent sale by another player’s agent on the location card, the value of that card is instantly transferred to the second player. If there are no recent sales on the card, then the first current or future listings that convert to a sale cause the owning player’s office to take control of that cardand to recover the VPs. The original controlling player can thus win back the VP value of that card if the next sale is theirs.
Populating the geographic farming tables and computing location card VP scores
A location card’s geographic farming table, in the upper right-hand corner of each card, has a background color matching the color of the density type for that card. It is used for geographic prospecting by any agent with a farm on the card. The geographic farming tables reflect the same logic that underpins the visibility point scores on the cards. They, along with the visibility points, were the most difficult elements to devise, and require explanation.
In the real world, any agents conducting geographic farming will start at a location and introduce themselves to residents. It could be as narrowly focused as a nine-block area. They may post or distribute flyers, mail post cards, and purchase local print advertising offering visibility in high-traffic venues like supermarkets. Even while focused on a specific farmed community, the exposure they receive should be expected to spread to surrounding neighborhoods or communities. Consequently, while their listing opportunities are most likely to be concentrated in their focused community, it is not uncommon for agents to draw invitations to list from one of these adjacent areas.
This also means that visibility of a community, indicating its desirability as a farm location, can be measured in terms of the concentrations of listings there among a constellation of communities comprising all adjacent locations. However, data that would easily serve this purpose and populate the geographic farming table are unavailable, and must be imputed. The NWMLS data include the listing brokers as well as the selling brokers, but no information about how they won those listings from their clients.
The need for both a model of prospecting that spawns listings in adjacent areas, and for quantitatively measuring visibility on the basis of sold listings farmed from a location requires a comprehensive solution. That solution should factor the proportional listings of all areas adjacent to the farmed location, while boosting the proportional share of listings at the center where prospecting originates.
The solutions for both these components—the farming tables and the visibility point values—were computed by a single spreadsheet. The three-year (2017-19) total sold listings of the location card's subject community or neighborhood were divided by the total of sales in all adjacent areas PLUS a base percentage from the subject location, adjusted to fit but averaging 18-20 percent ADDED TO an imputed exurban share set at 5-15 percent24 AND together multiplied by those local counts of closed sales at the location card. The quotient was then rounded to a single-digit percentage value. This procedure was followed for each subject location card and all adjacent cards, with the figures along each row used to populate the DR100 geographic farming table to resolve new listing destinations originating from a farm on the card.
From the same spreadsheet, the computed percentage values along each column were totaled as the shares of sales imputed as originating from adjacent areas, then multiplied by 100 and rounded to formulate the visibility point totals for each card. This method has been used to produce a value that reflects, among a cluster of location cards, the concentration of sales at each location relative to all of its neighbors, implying greater visibility to the most concentrated cards indicated by the highest VP scores.
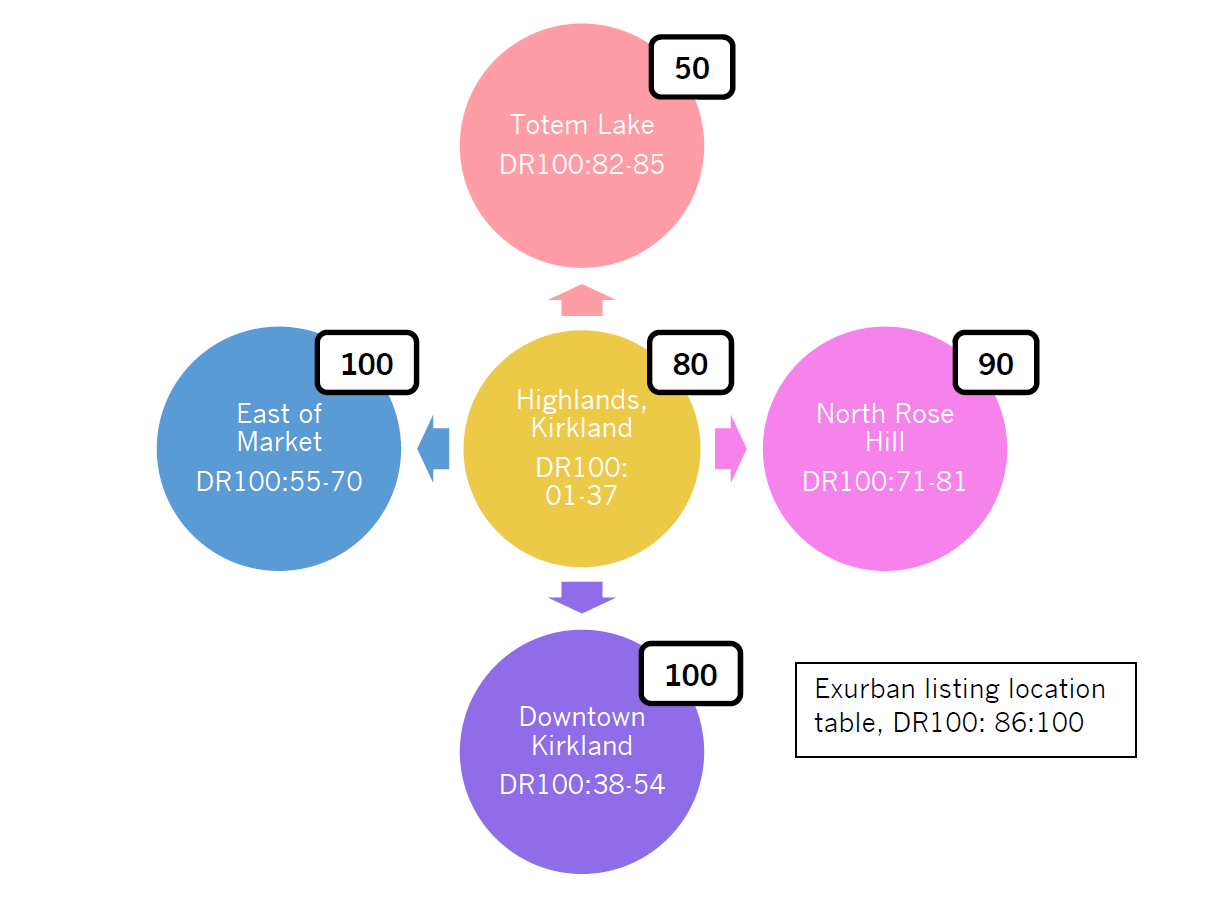
24 It was assumed that larger shares (10-15 percent) of inbound exurban listings would be from affluent urban areas, with smaller shares (five percent) originating from other exurban areas—i.e., that most listings of exurban properties for sale would be requested from the same or adjacent towns.
Schedule of entries
- Spheres & Farms™ design and strategy journal: Introduction
- The agent and brokerage as real estate brands
- How price and place matter
- Visualization, testing, and learning
- Spheres & Farms™ game summary
- Game procedures and routines in the context of agency law and practice
- Game components; agent counters and cards
- Farming methods; market selection
- More about marketing spheres; the economic cycle track (ECT)
- Economic cycle effects on marketing spheres
- Location cards: the Spheres & Farms™ "game map"
- Location card contents, office locations and maintenance
- The prospecting/event card deck
- Prospecting for listings and incurring events
- P&CR points: promoting and selling listings
- Construction projects and pre-sales